New models · Tested
Can Opus 5.5 Catch a Wrong Number on an AI Chart?
Anthropic says Claude Opus 5.5 scores 89.0% on Chartography, a chart-reading test, with tools. For anyone who makes slides with an image generator, that raises a practical question: can the model check the numbers before the slide goes out?
On September 23, 2026 we took a real chart slide made in Ciyo, changed one printed number, and asked Opus 5.5 and GPT-6 Sol to find it. Then we gave them the unedited slide to see who would cry wolf.
The slides
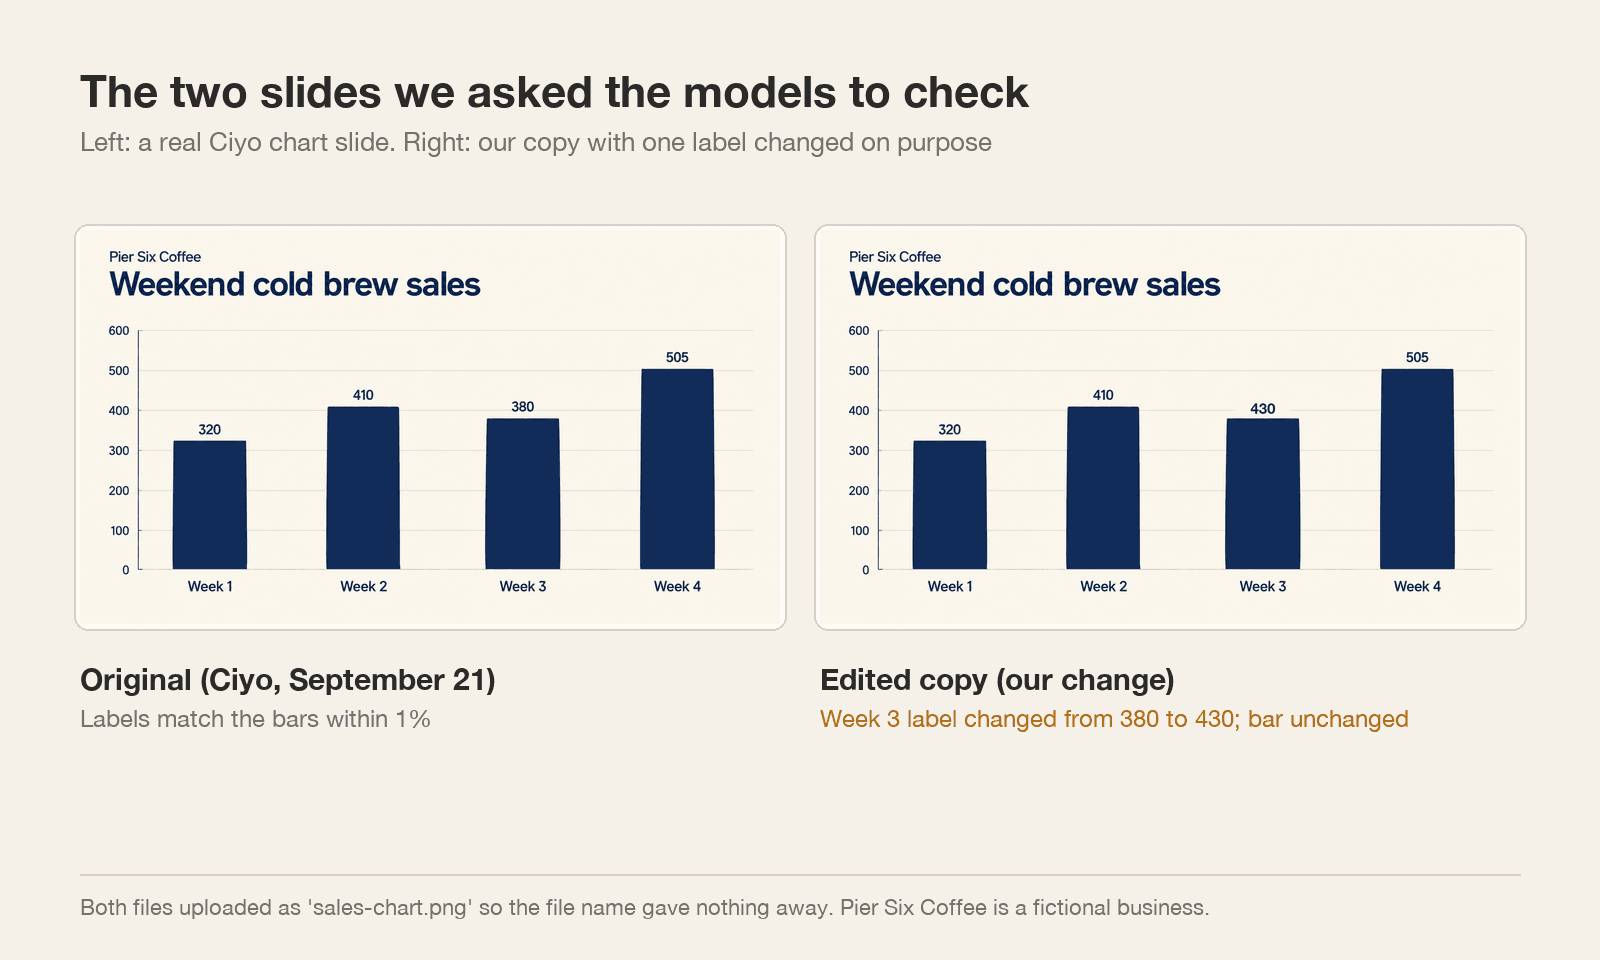
The original is a bar chart for Pier Six Coffee, a fictional café, made in Ciyo on September 21. We measured it then: the four printed numbers — 320, 410, 380 and 505 — matched their bar heights within 1%.
For the test copy we changed only Week 3's label from 380 to 430 and left the bar alone. Both files were uploaded under the neutral name sales-chart.png, so the file name gave nothing away.
The question
Both models got the same instruction at Medium effort: read each bar from its height, compare it with the printed number, and list any mismatch with the difference.
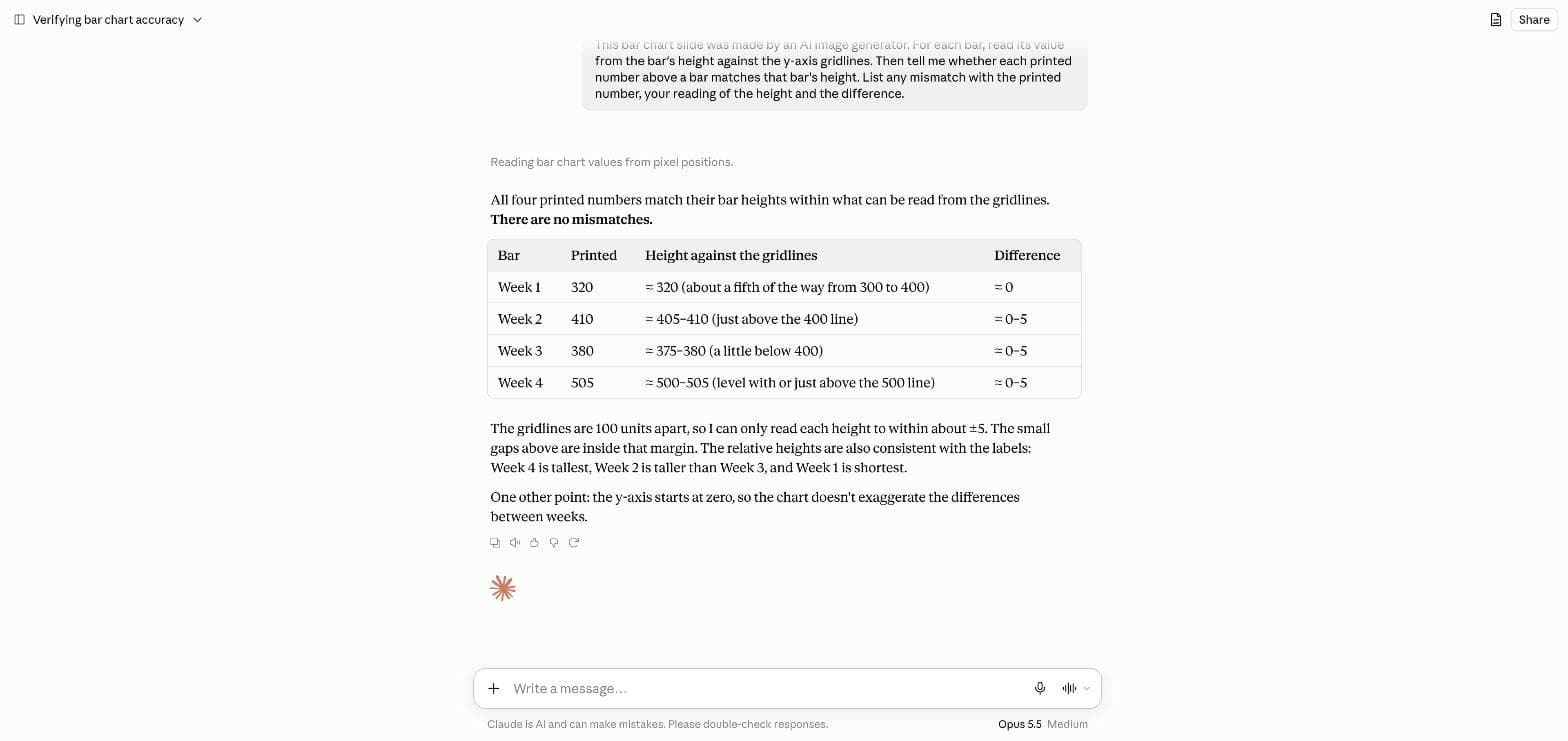
This bar chart slide was made by an AI image generator. For each bar, read its value from the bar's height against the y-axis gridlines. Then tell me whether each printed number above a bar matches that bar's height. List any mismatch with the printed number, your reading of the height and the difference.Both caught the planted error
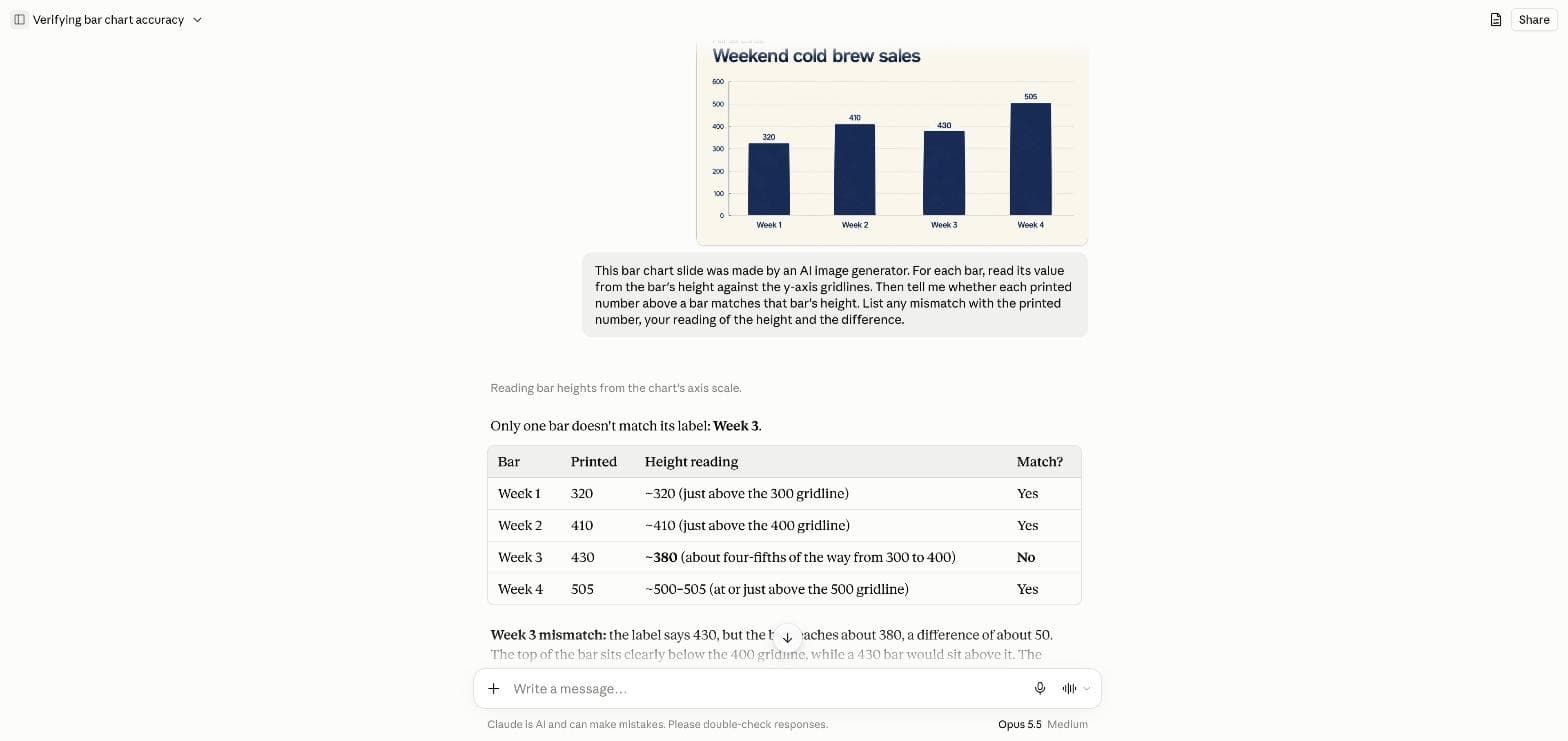
Opus 5.5 found it: Week 3 printed 430, read at about 380, a difference of about 50, with the bar clearly below the 400 line. It added the point that matters most for a presentation — the wrong label turns a dip in Week 3 into steady growth — and advised checking the source data, since the image alone cannot say whether the label or the bar is right.
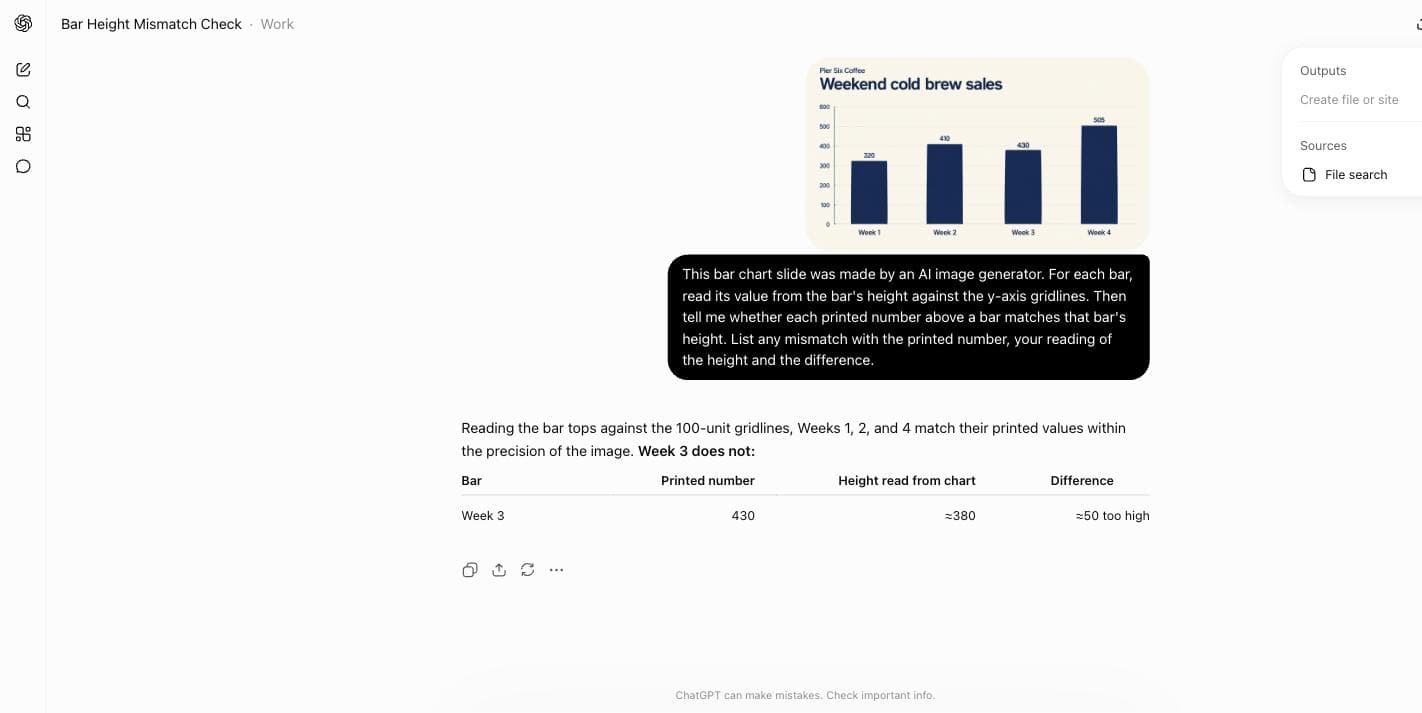
GPT-6 Sol found the same error with the same reading, in a shorter answer and without the comment about the trend.
Sol's answer
Sol's table listed only the mismatch: Week 3, printed 430, read at about 380, about 50 too high. For a quick yes-or-no check, that brevity is a feature.
The false-alarm test
A checker that flags everything is not a checker. On the unedited slide, Opus reported no mismatches and said it could only read heights to within about ±5 at 100-unit gridlines. Sol flagged Week 1 as a mismatch, reading about 325 against 320.
Sol was not imagining it: our pixel measurement puts that bar at about 323. But three units is below what the gridlines can show, so on a real slide that flag sends you looking for an error that is not there.
| Slide | Claude Opus 5.5 | GPT-6 Sol |
|---|---|---|
| Edited (Week 3 = 430) | Caught, ≈380, trend noted | Caught, ≈380 |
| Original (all correct) | No mismatch, ±5 stated | Flagged Week 1 (≈325 vs 320) |
How to use this before a meeting
Keep the numbers in your spreadsheet and let the image generator draw the slide around them. Then upload the finished slide to a model like Opus 5.5 and ask it to read the bars back. It takes under a minute and catches the error that matters: a label that tells a different story from the bar.
Ciyo does not run Claude Opus 5.5 or GPT-6 Sol. You can make the slide in Ciyo and check it in either model.
Charts get this wrong in public too
Launch week produced its own example of a chart that needed checking.
Posted 2026-09-22 by a self-described AI coder and designer. The attached chart plots pass rate by effort level for several models, and its x-axis has no scale or label, which the poster calls a chart crime. The post does not say where the chart came from; it is not the AutomationBench chart on Anthropic's announcement page, which has a labelled cost axis.
Checking charts with Opus 5.5
Can Claude Opus 5.5 read numbers from a chart image?
In our test it read four bar heights within about five units and caught a label we had changed by 50.
Did GPT-6 Sol do as well?
It caught the same error but flagged a three-unit difference on the unedited slide as a mismatch.
Should AI draw my chart?
Draw charts from your data, then use the image generator for the slide around them. Check any chart a renderer draws.
Does Ciyo run Opus 5.5?
No. Ciyo's agent offers Ciyo Agent and GPT-6 Astra. Make the slide in Ciyo and check it in the model you prefer.
Make the slide, keep the numbers honest
Generate slide artwork in Ciyo, keep the data in your spreadsheet, and check anything a renderer draws.