Chart design
Print an axis-label test strip for a scientific poster
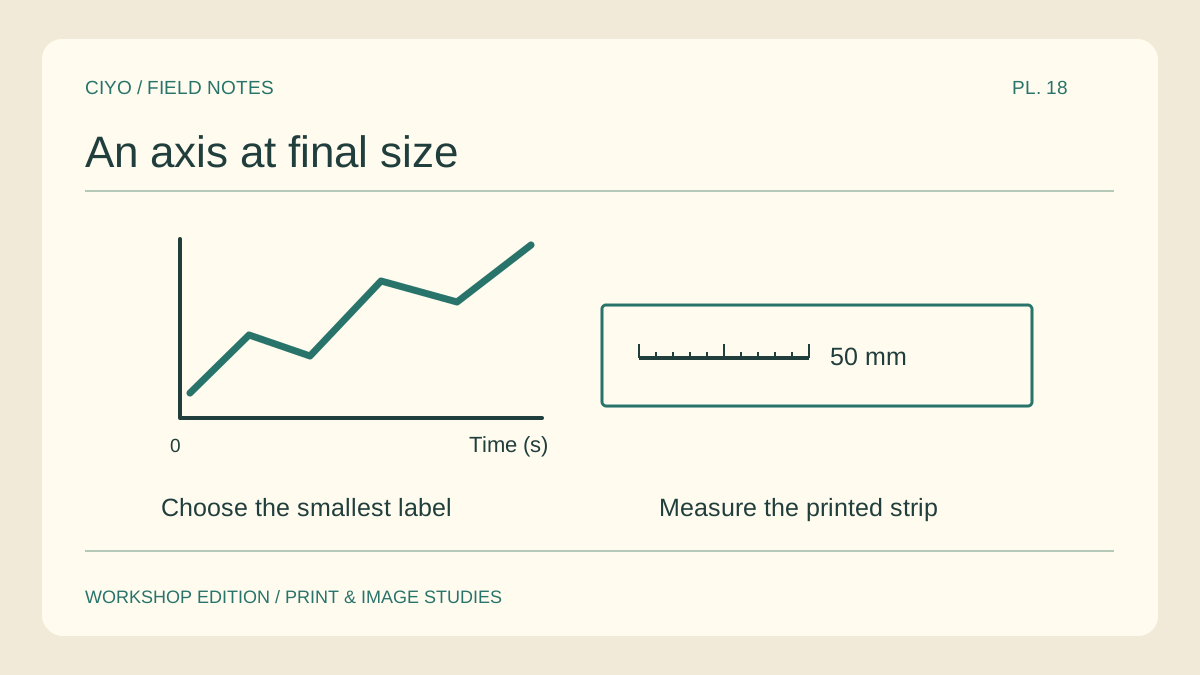
A scientific poster can look immaculate on a zoomable screen and still have an unreadable axis at the board. Print one small strip at final size before paying for the full sheet. Choose the most demanding part of the actual figure.
Select a difficult region
Include the longest tick label, the unit, a point marker and a legend entry. A sample containing only the chart title gives a false sense of readability because the title usually has the largest type.
Preserve physical scale
Copy the region onto a small proof page without scaling the artwork. Add a 50 mm reference line. After printing at actual size, measure that line with a ruler before making decisions about the letters.
Read from the intended position
Mount the strip at roughly the height it will have on the board. Ask a colleague to read a number with its unit and point to the corresponding series. Record the first item they cannot distinguish.
Adjust the measured problem
If the unit is visible but crowded, give the label more space. If two markers look the same in grey, change their shapes. Enlarging everything together may crowd the legend and hide the very distinction you wanted to improve.
Check the regenerated figure
Export the plot again from the source and repeat the same strip. Look for substituted symbols, clipped superscripts and shifted minus signs. These small marks can change the meaning of a result even when the headline stays correct.
Attach the accepted proof
Keep the approved strip with the final poster file and print settings. A tiled copy can serve as an inexpensive assembly proof before a large-format run. Use the same physical scale when comparing the two outputs.
Tile a chart proof
If the chart is available as a raster image, choose the sheet count that matches the target width. Check the measured bar before using the proof.