Opus 5.5 motion production
Opus 5.5 Animated Charts: Keep the Numbers Honest

A studio needs a short explainer showing how workshop bookings could differ across three sessions. The values 12, 18 and 15 are fictional illustration data. They must stay visibly labeled that way in the animation.
The task is to animate a clear chart without turning the animation into a misleading comparison. Use measured data only when you have its source and definition.
Ciyo’s Opus 5.5 agent built the fictional worked example below with code. The linked MP4 is the actual product export, drawn with Pillow and encoded with FFmpeg; it is not a generated camera-footage clip.
1. Write the data contract
Record labels, units, values, source and whether the data is illustrative. For our example: morning=12, afternoon=18, evening=15 seats; the caption says “Illustrative example — not actual bookings.” Keep that caption in every scene where the bars appear.
Avoid a vague success claim. A larger bar in a fictional example proves no marketing outcome and supplies no evidence that a workshop filled.
2. Fix the scale before animating
Use a stable zero-to-20 scale for the example. A value of 12 occupies 60% of its full scale height; 18 occupies 90%; 15 occupies 75%. Keep the axis unchanged while the bars grow.
Animate progress from zero to one, then multiply it by each target value. Keep displayed numbers synchronized with the bars, or show final values only after the bars settle.
| Session | Example seats | Share of a 20-seat scale |
|---|---|---|
| Morning | 12 | 60% |
| Afternoon | 18 | 90% |
| Evening | 15 | 75% |
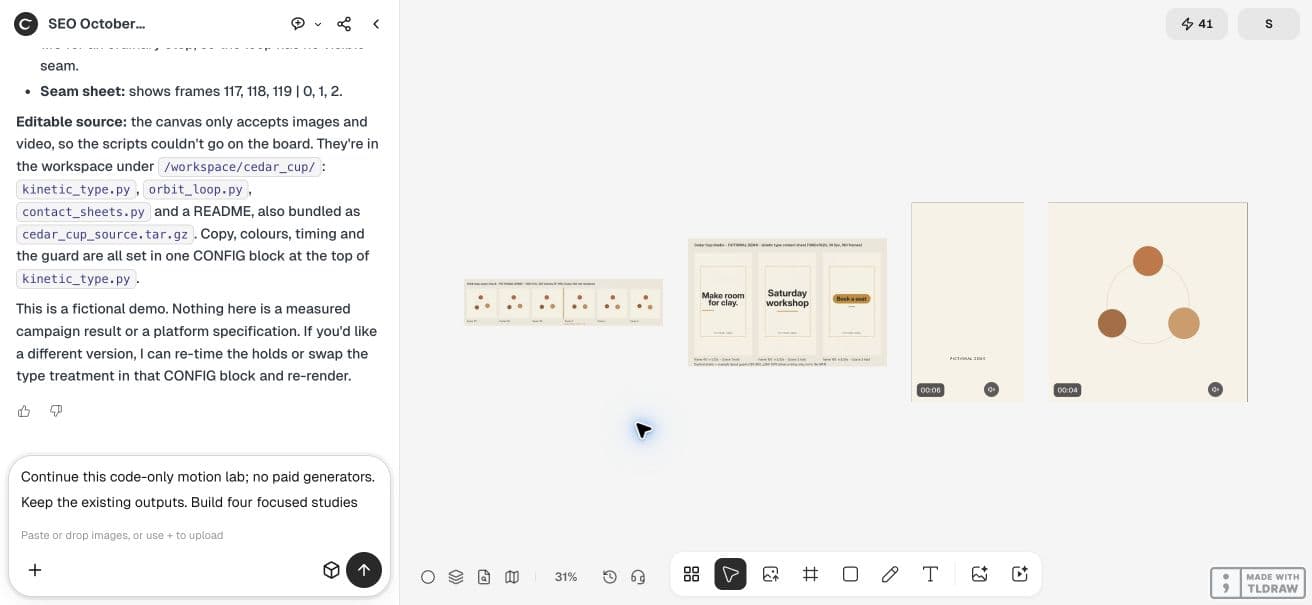
Use code only. Create a six-second silent 1080x1080 animated bar chart for fictional Cedar Cup Studio. Illustrative values: Morning 12, Afternoon 18, Evening 15 seats. Fixed zero-to-20 scale, equal bar widths, no overshoot. Persistent caption: Illustrative example — not actual bookings. Animate bars and numbers consistently, hold final values. Export MP4 and source, add mid-animation and settled frames to canvas, report the calculated final height ratios.3. Protect labels during the movement
Keep labels readable at the intended display size. If the number rides above its growing bar, check the label’s bounds throughout its motion. It should not collide with the chart title when the tallest bar reaches its target.
Do not use unequal bar widths to suggest different totals. For this simple comparison, keep widths equal and use height for the value. Explain any deliberate visual encoding before relying on it.
4. Decide whether easing is appropriate
A decorative entrance can ease in. A data bar should never visually exceed its final value if the viewer may interpret that as a real reading. Clamp the data progress or use an easing curve with no overshoot.
If the narrative needs a bounce, animate a decorative frame instead of the measurement. Remotion documents clamping interpolation; the same principle applies in a custom renderer.
5. Generate and inspect a small chart study
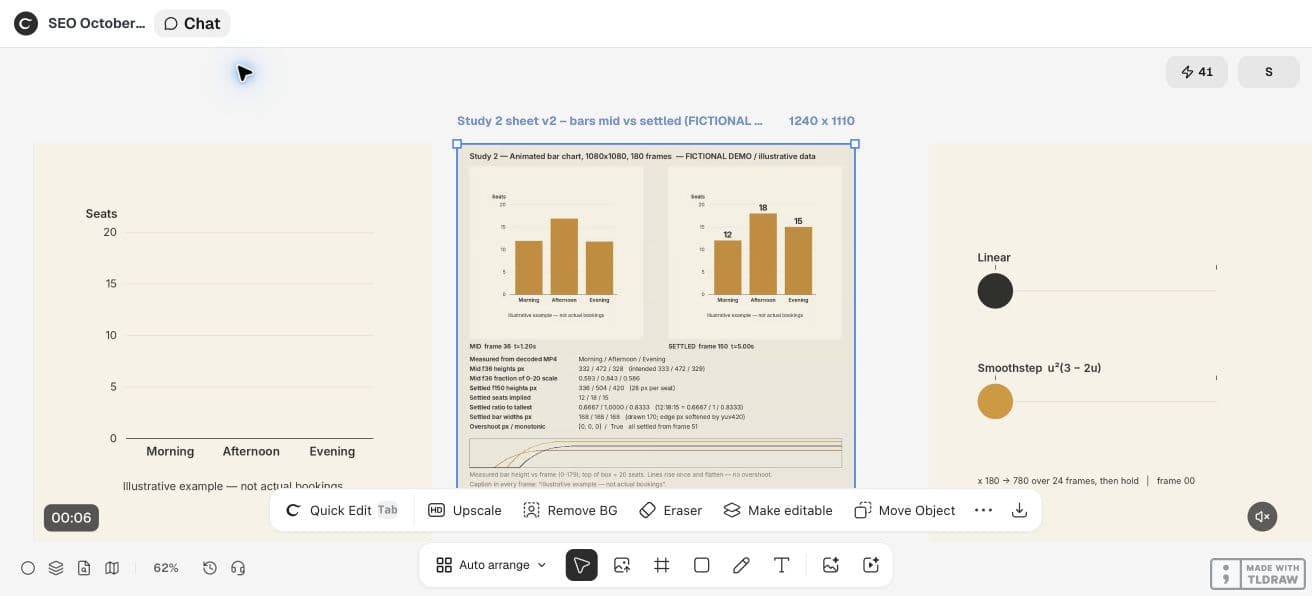
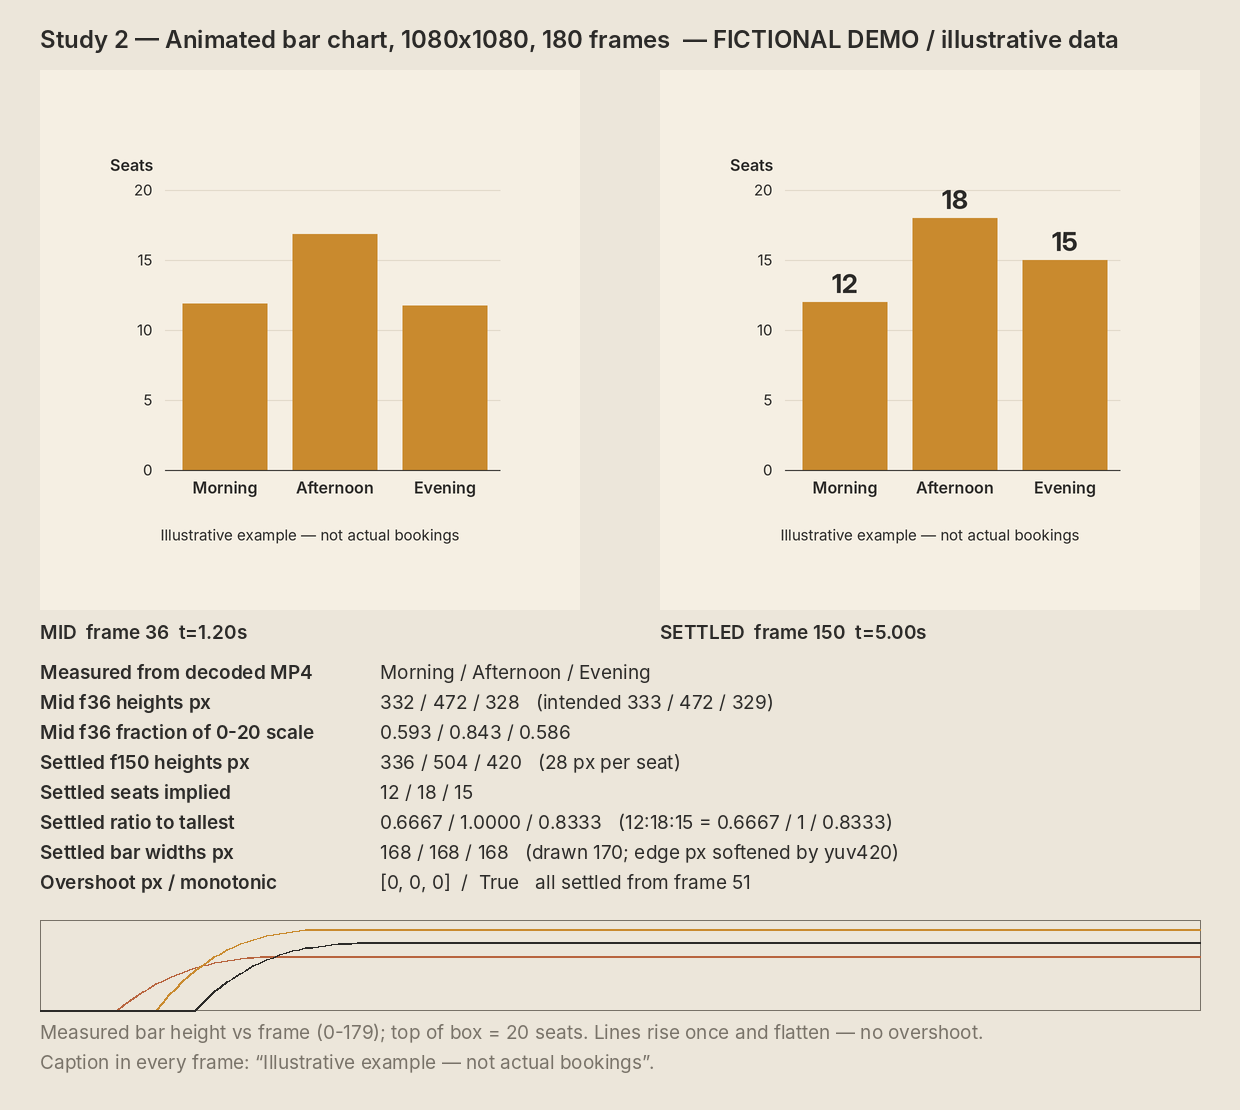
In Ciyo, ask the agent for a silent chart MP4 plus source and a contact sheet. Check a mid-animation frame and a settled frame against the input values. The mid-frame review detects label/bar disagreement that the final frame hides.
Request a fixed scale and persistent illustrative-data caption explicitly. If either disappears during a transition, correct the source and repeat the same frame checks.
The live chart export has 180 counted frames, 30fps and a six-second duration. The agent’s decoded-frame inspection reported settled heights 336, 504 and 420 pixels against a 560px scale: 0.6, 0.9 and 0.75 of the scale. Those correspond to the fictional 12, 18 and 15 seats.
The bars animate with staggered starts, so their mid-animation ratios differ from their final ratios. Final numbers therefore need a distinct settled review. The persistent caption identifies the values as illustrative; this is not studio booking data.
In this demo, Ciyo saved the Python sources in the project workspace but could not attach a source archive to the canvas. Ask the agent to paste the source in chat when you need a copy outside that workspace; the video download is a separate deliverable.
CFNStudio contrasts Opus 5.5 with and without the Motion harness. This concerns another tool; our data contract is an original Ciyo exercise, not a test of that harness or an endorsement.
6. Keep the data beside the delivered source
Deliver the source data, scale rule, approved labels and export revision together. If the values change, rerender from the new data rather than editing a number on top of an old bar.
Ask a reviewer to read the highest and lowest sessions from the final export. A correct calculation is necessary; a readable comparison is the practical result.
Practical questions
Can I use made-up data in a worked example?
Yes, when it is clearly and persistently labeled illustrative. Never describe it as measured performance.
Should the axis change while bars grow?
Keep it fixed for this comparison so the bar heights retain a consistent meaning.
Can a spring overshoot a data bar?
It can, but that may misrepresent the value. Clamp the bar and use bounce only on decorative elements.
Make a small motion study you can check
Open an isolated Ciyo project, bring your approved copy, and ask the agent for source, a rendered draft and the specific checks your deliverable needs. Review the actual export before using it.